-
 EN
EN
-
 IT
IT
Elwave 10 version Intraday and EOD
480 euro + VAT
The Intraday version and EoD of ELWAVE is an excellent graphical analysis software that automatically reads data in both daily and intraday Metastock format, allowing you to view long time series.
It is the best among the software that allows you to work with Elliott’s waves.
Features.
Many graphical analysis tools and price chart types such as candlestick.
Several indicators available, such as RSI, MACD, Elliott Oscillator, Alligator, Awesome, Williams Accelerator, Mobile Media, Bollinger Bands, and so on.
Trading Simulation function that allows you to manually decide to buy or sell and test the strategy. The software tells you exactly how to monetize your strategy.
It’s easy to spot Elliott’s waves on the chart, which will be verified by the software and saved in the settings.
This version can be upgraded with other modules in the Full version (automatic trading, trading signals, Cluster Targets, Exploration, Real Time).
Technical information:
ELWAVE is available for Windows XP/Vista/7/8 and Windows NT 3.51 and runs at 32 and 64 bit.
The main features of the Intraday version of ELWAVE are:
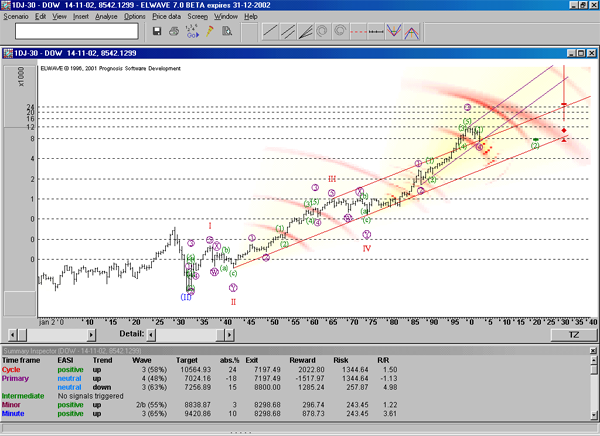
A. Waves of Elliott
ELWAVE graphics integrated with Elliott’s wave principle. The software will display the waves in the graph classifying them according to the wave degree and will be clearly visible at all times in the right proportions in the right place, even when using the zoom.
The detail of the waves can be adjusted by degrees in the graph. When new data is loaded, new waves can be added. The use of drag and drop makes it very easy to manage the wave labels.
An unlimited number of graph scenarios can be defined and saved for the same data in the graph. These scenarios can be compared and exchanged. When a scenario is no longer “preferred” it can be easily replaced.
As soon as waves are detected and labeled, channels can be drawn automatically, simply by placing them on the wave label.
By selecting the label of a wave the software will then be able to calculate the selected Fibonacci price ratios for each wave grade.
Logarithmic spirals can be added to the graph wherever you want.
Once the wave count is complete for a graph, Elwave will provide information on the validity of the count. You can then project a model to predict future price trends.
B. Technical Analysis
The most common requirements for technical analysis have been included in ELWAVE:
Intraday, daily, weekly and monthly price charts, with the ability to “zoom” to load 60,000 lines of data (no limit for the use of ASCII files, depending on the internal memory and / or a hard drive), line charts, bars and canfdlestick, possibility to compare several charts simultaneously and save them.
Volume indicators: just click once with the mouse to display the indicator.
Trend lines and channels can be placed anywhere, both in the chart and indicators.
ELWAVE basic module reads only data at the end of the day the Intraday version reads intraday data, from tick by tick to time format. The release also supports a real-time data source via a link called DDE, if supported by a Real Time data provider. The fact that ELWAVE can read large data files is very convenient for intraday data.

